
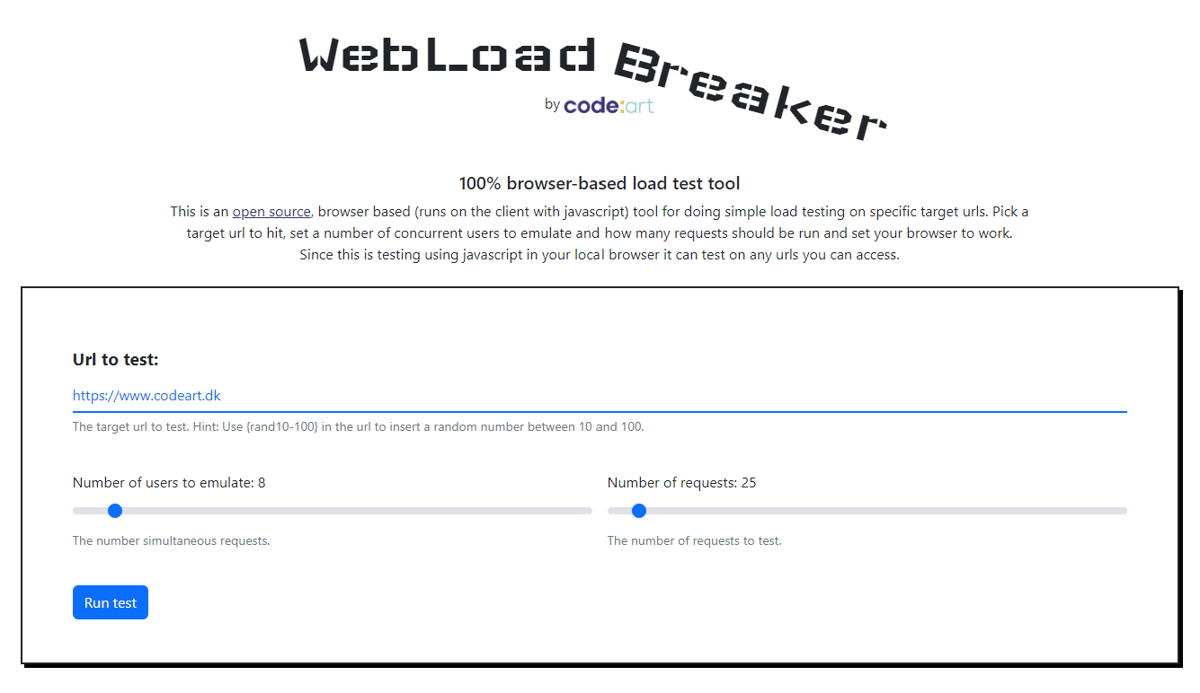
WebLoadBreaker is a new, open source, browser based tool to help you do quick and easy load tests.
One of the key performance elements to test before your release your website is not just how fast the user experience is (which is often tested in tools like Lighthouse or PageSpeed), but also how efficient it behaves under a certain expected load. In order to do that test you need to put the site under a certain load and then measure both how many requests per minute it can process - but also how fast those requests respond.
There are numerous load testings tools available for this - I usually prefer Netling which is simple, but gets the job done. However, most of the the tools needs to be installed on an environment where they can access the urls that needs to be tested. This can sometimes be tricky and risky to do in a secure environment - not to mention the bureacracy sometimes needed to persuade IT to allow the tool.
To make things a bit easier I recently made WebLoadBreaker - a simple, browser based tool to do some simple load testing on a url. And of course it's available as open source.
WebLoadBreaker is really very simple. It uses vanilla js to fetch a provided url asynchroneously (and in parallel) a certain number of times, while simulating a certain number of users. While doing this it also measures the durection of each call and calculates some basic metrics on top of that.
Basically, you just provide it with a url to hit, a number of users and a total number of requests you want it to do - and then run the test.
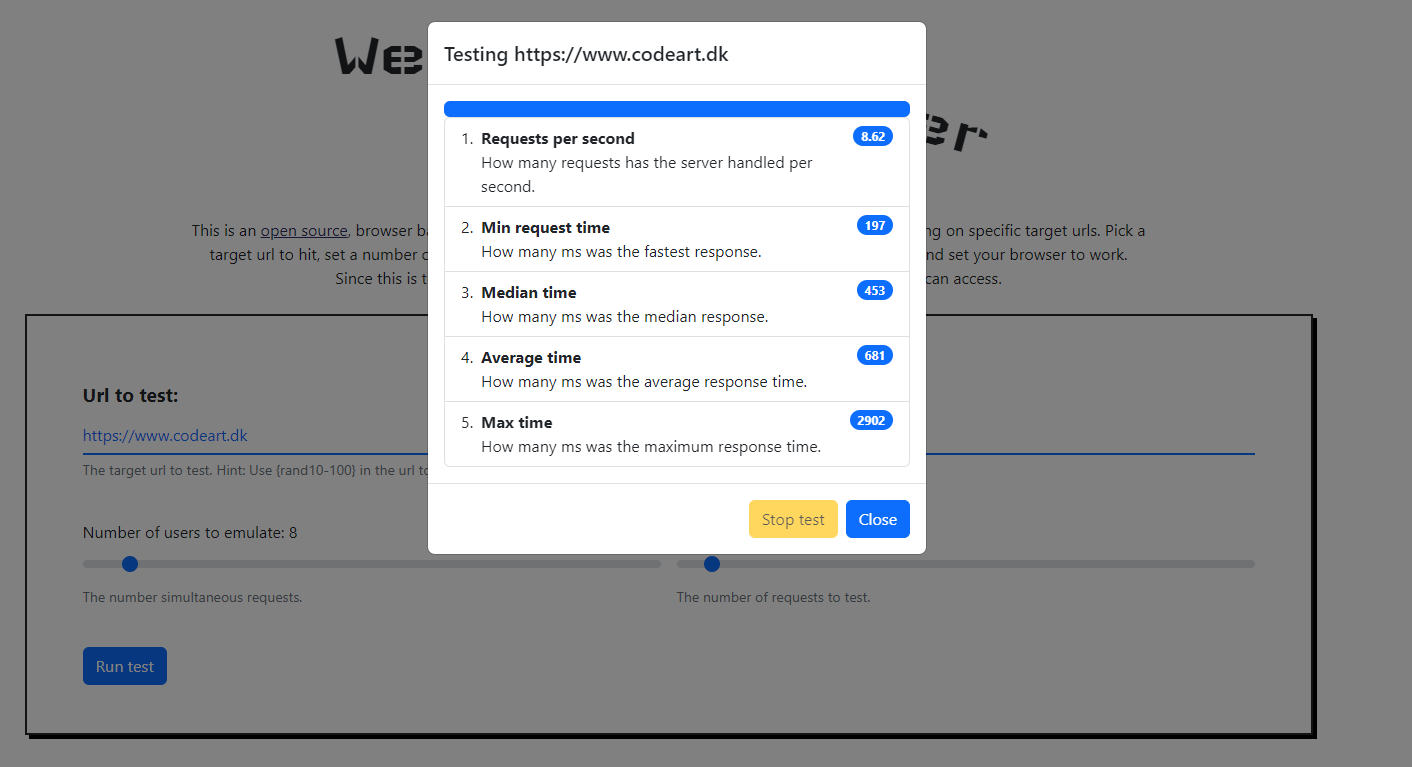
The key metric I usually look for is Requests per second (RPS). As you can see above - this site, codeart.dk is not doing particularly well - however handling a lot of simultaneous users has never been a big need (at least not yet). It is of course also worth taking a look at the response times - keep in mind that with this tool you are typically only testing the html part - not the full page load with images, scripts, styles and so on. It should ideally always be under 1 second.
Another thing to keep in mind is that this is a tool running in your browser. The performance measured also includes roundtrip to the server and the capacity of the browser in handling multiple concurrent fetch requests. On well-performing sites you could potentially reach the browser/trafffic bottleneck before the servers. However, I have found that for many sites you can clearly see potential for improvements using this tool - and then when you improve them, you can also see the improvement with this tool. And that's really what it was made for.
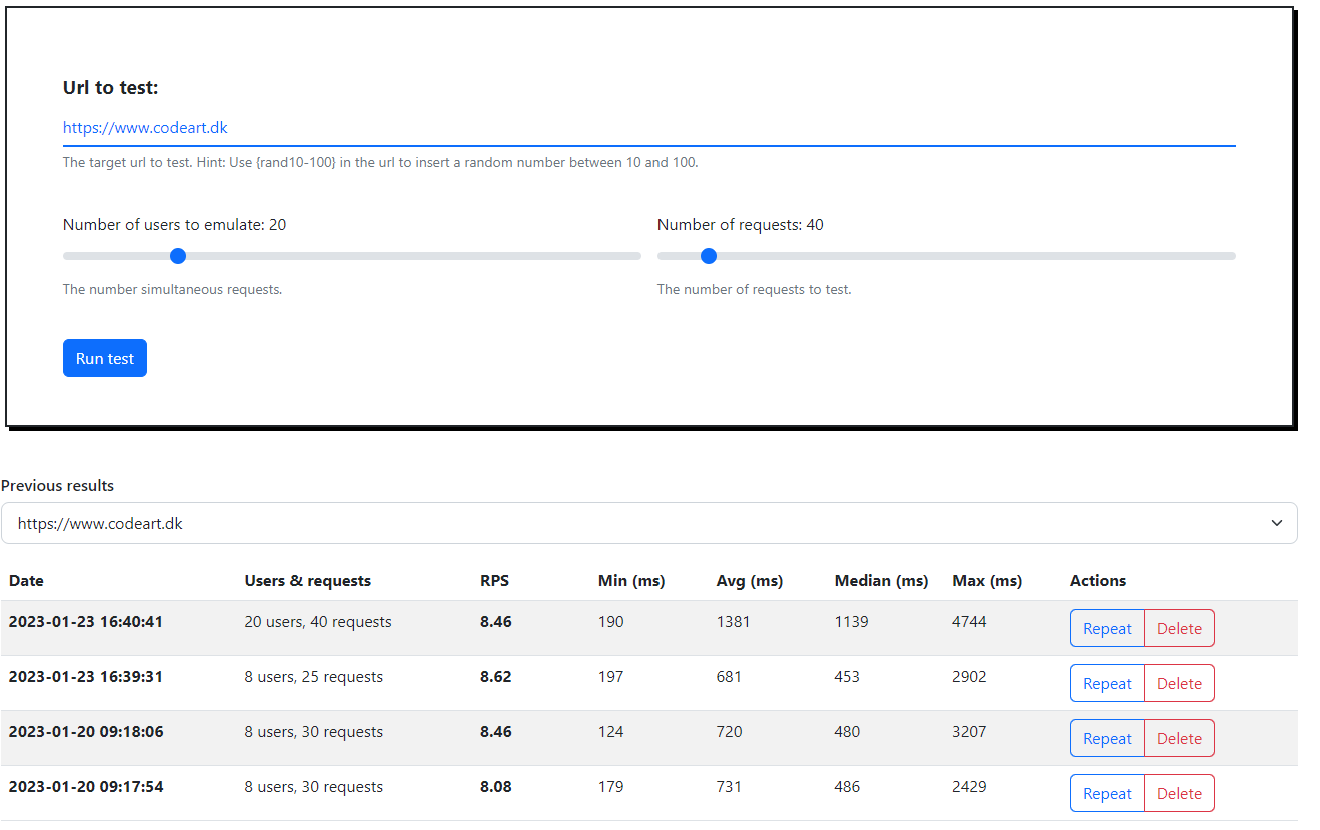
After the test is complete, it will store the metrics in your browsers local storage so you can compare each url with previous results.
All of this is done completely using javascript and can run in most modern browsers (tested in Chrome and Edge) without any problems.
You can even fetch the code from the repository and run it locally - that works as well.
As I'm curious by nature - and want to see if this service ends up getting used, I put a Matomo-tracker in there - but it runs without cookies, anonymized IP's and it does not track the urls being tested. However, feel free to fork the code and remove the tracking - it's clearly marked.
Additional Features
- You can set the parameters in the URL like this: https://codeartdk.github.io/WebLoadBreaker/?url=https://www.codeart.dk/&users=5&requests=10 and thereby link to a specific test.
- You can define random numbers in the URL - for example to bust caches when testing. Like this: https://www.codeart.dk/?nocache={rand0-1000}. This will insert a random number between 0 and 1000 where the placeholder is.
- It is a progressive web application. This means you can install it on your desktop and get a shortcut for it for easy access - or have it as an app on your smartphone (although I don't know why you'd want to do that).
Shortcomings
- The biggest problem right now is that the script cannot see the HTTP response code returned from the fetch operations. This is due to CORS and is a security feature built into the browsers. This means that you have no way of knowing if every single hit is a 200 Ok, or a 'Server busy' or maybe even a 404. I'm still investigating ways to get around this issue - but for now my best advice is to take a look in the browsers Developer Tools in the "Network" pane where all the requests and responses can be seen - if you suspect that something is wrong. Typically server rejections are a lot faster than normal processing - so if you all of a sudden get responses back way faster than before - then take a look.
- There is very little input validation still. This is a work in progress. If you input garbage you'll get garbage out.
Call for participation
If you like the project and would like to make it even better - either by submitting pull requests, bug reports or suggestions for features I'd really appreciate it. Drop a comment below or send mea mail - or fork the project and make a pull request!
https://codeartdk.github.io/WebLoadBreaker/
https://github.com/CodeArtDK/WebLoadBreaker
Try it out!